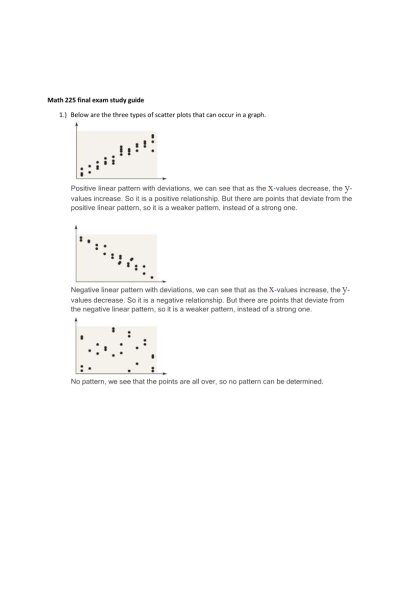
- Below are the three types of scatter plots that can occur in a graph.
- Given the table below, what would the regression equation be?
- Suppose you computed r = −0.745 using n = 25 data points. Using the critical values table below, determine if the value of r is significant or not.
- Brandon is studying the relationship between the time spent sewing a blanket per day and the length put on the blanket in millimeters per day and has collected the data shown in the table. The line of best fit for the data is y = 0.342x – 42.05. Assume the line of best fit is significant and there is a strong linear relationship between the variables.
- A scientific experiment on skingrowth gives the following data table.
- The data is provided below. Use Excel to calculate the correlation coefficient r between the two data sets. Round your answer to two decimal places.
- Given the plot of normal distributions A and B below, which of the following statements is true? Select all correct answers.
Remember if z= negative this is to the left of the mean and z=positive is the right of the mean.
- John has collected data to find that the number of pages per book on a book shelf has a normal distribution. What is the probability that a randomly selected book has fewer than 191 pages if the mean is 225 pages and the standard deviation is 17 pages? Use the empirical rule. Enter your answer as a percent rounded to two decimal places if necessary.
- Find the area to the right of the z-score 0.27 under the standard normal curve.
Use the value(s) from the table above.11.)
12.)
13.)
- A teacher claims that the mean amount of time that a person spends studying for math
is 47 minutes. Identify the null hypothesis, H0, and the alternative hypothesis, Ha, in terms of the parameter μ.
- What would be a possible scenario for the following results in the null hypothesis μ≥47 and alternative hypothesis μ<47?.
- These are the graphs that match each of the following hypothesis tests.
18.)
19.) What is the p-value of a right-tailed one-mean hypothesis test, with a test statistic
of z0=1.97? (Do not round your answer; compute your answer using a value from the table below.)
- Penny, a competitor in egg spinner, claims that her average egg spinning time is 10.7 seconds. During a practice session, Penny has a sample spinning time mean
of 9.8 seconds based on 18 trials. At the 5% significance level, does the data provide sufficient evidence to conclude that Penny's mean spinning time is less
than 10.7 seconds? Accept or reject the hypothesis given the sample data below.
- A recent study suggested that 79% of patients with trauma on their leg take at least one pain pill. Shawn is a PA at a medical walk-in clinic who would like to know whether the
percentage is the same for patients who go to his clinic. He randomly selects 75 patients who were treated at the clinic and finds that 64 of them take at least one pain pill. What are the null
and alternative hypotheses for this hypothesis test?
- A researcher claims that the proportion of cars with green tint lights is less than 13%. To test this claim, a survey checked 1700 randomly selected cars. Of those cars, 183 had a green tint lights.
The following is the setup for the hypothesis test: H0:p=0.13 Ha:p<0.13
Find the test statistic for this hypothesis test for a proportion. Round your answer to 2 decimal places.
- A medical researcher claims that the proportion of people taking a certain medication that develop serious side effects is 15%. To test this claim, a random sample of 405 people taking the medication is taken and it is determined that 49 people have experienced serious side effects. .
- An economist claims that the proportion of people who plan to purchase a fully electric vehicle as their next car is greater than 71%.To test this claim, a random sample of 877 people are asked if they plan to purchase a fully electric vehicle as their next car Of these 877 people, 621 indicate that they do plan to purchase an electric vehicle.
The following is the setup for this hypothesis test:
- Derek's math teacher was teaching the class how to perform the z-test for a proportion. Derek was bored because he had already mastered the test, so he decided to see if the coin he had in his pocket would come up heads or tails in a truly random fashion when flipped. He discretely flipped the coin 77 times and got heads 43 times. Derek conducts a one-proportion hypothesis test at the 5% significance level, to test whether the true proportion of heads is different from 50%.
What are the correct null and alternative hypotheses for this test?
| Instituition / Term | |
| Term | |
| Institution | Chamberlain |
| Contributor | Nydia Whitaker |


